Research often involves complex analysis of various data of multiple nature. I love to integrate data in single graphics. The selection below contains infographics of my PhD research Technology Campuses and Cities, which describe mainly processes and using historical, numeric and/or geographic data. Complex data can be transformed into beautiful information. I can support researchers in this task!
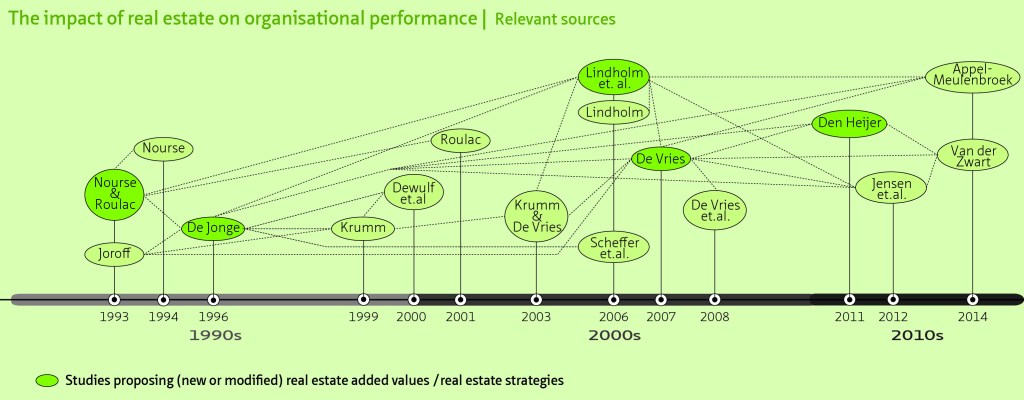
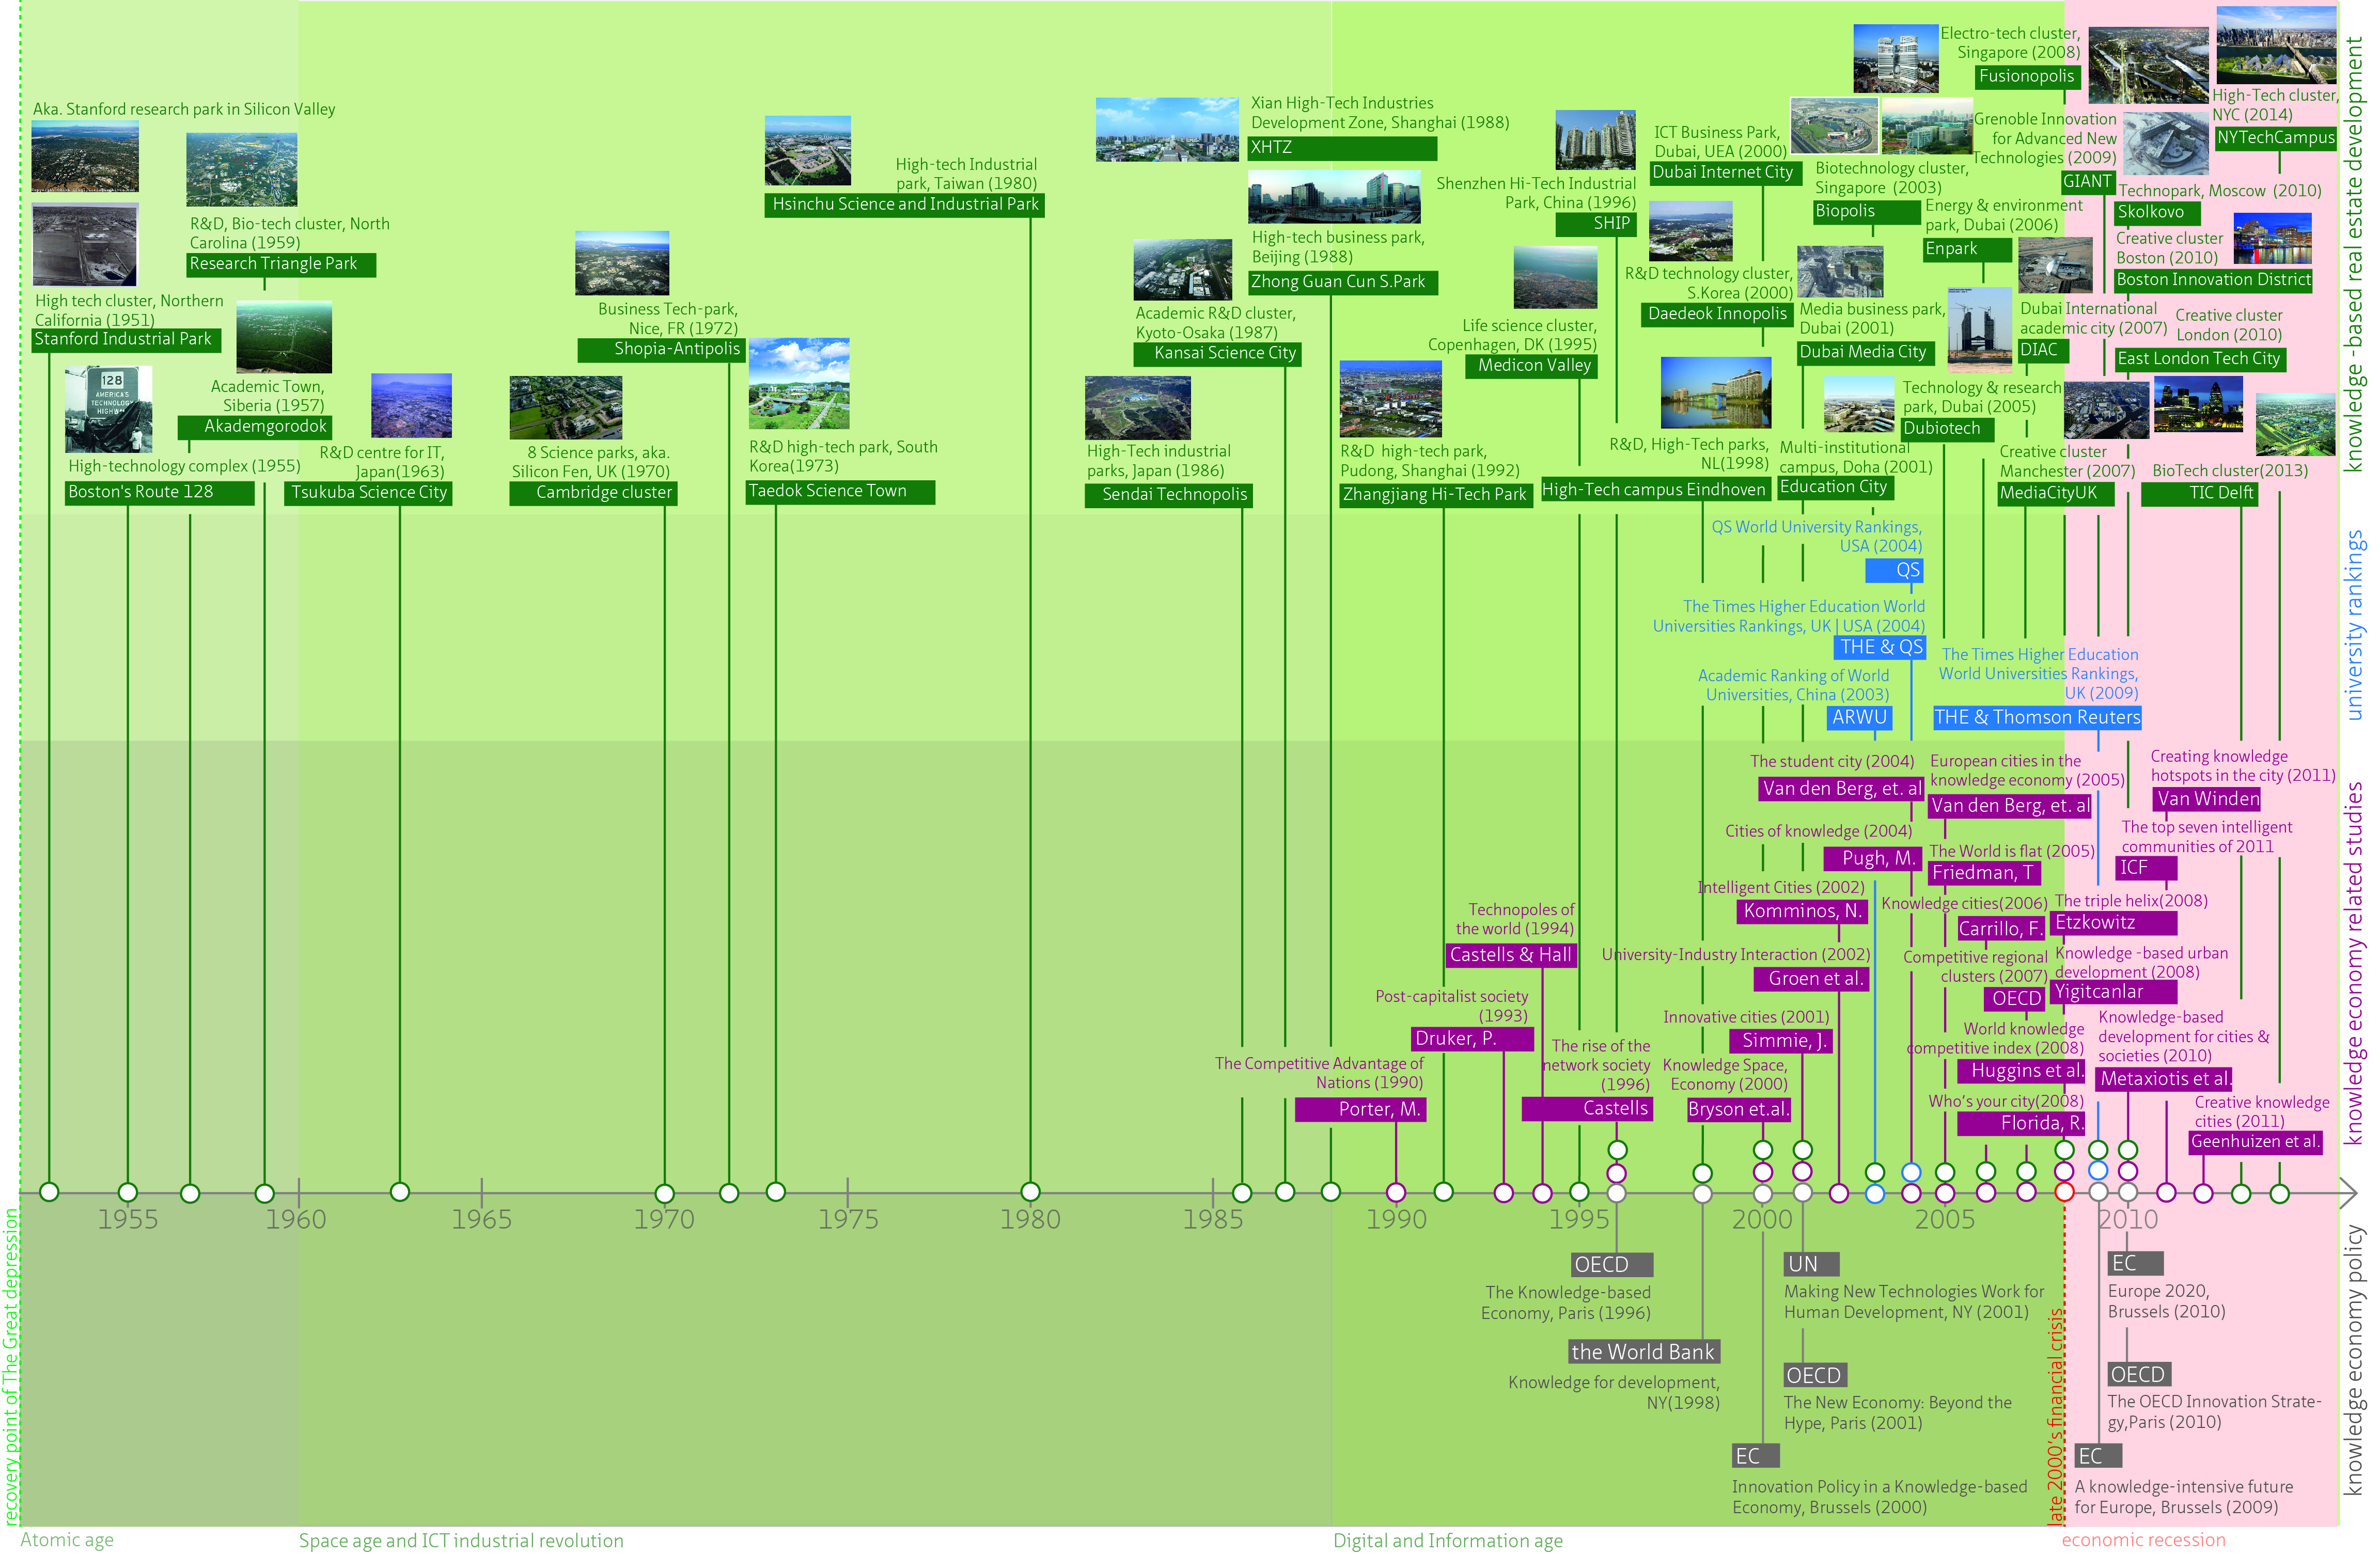
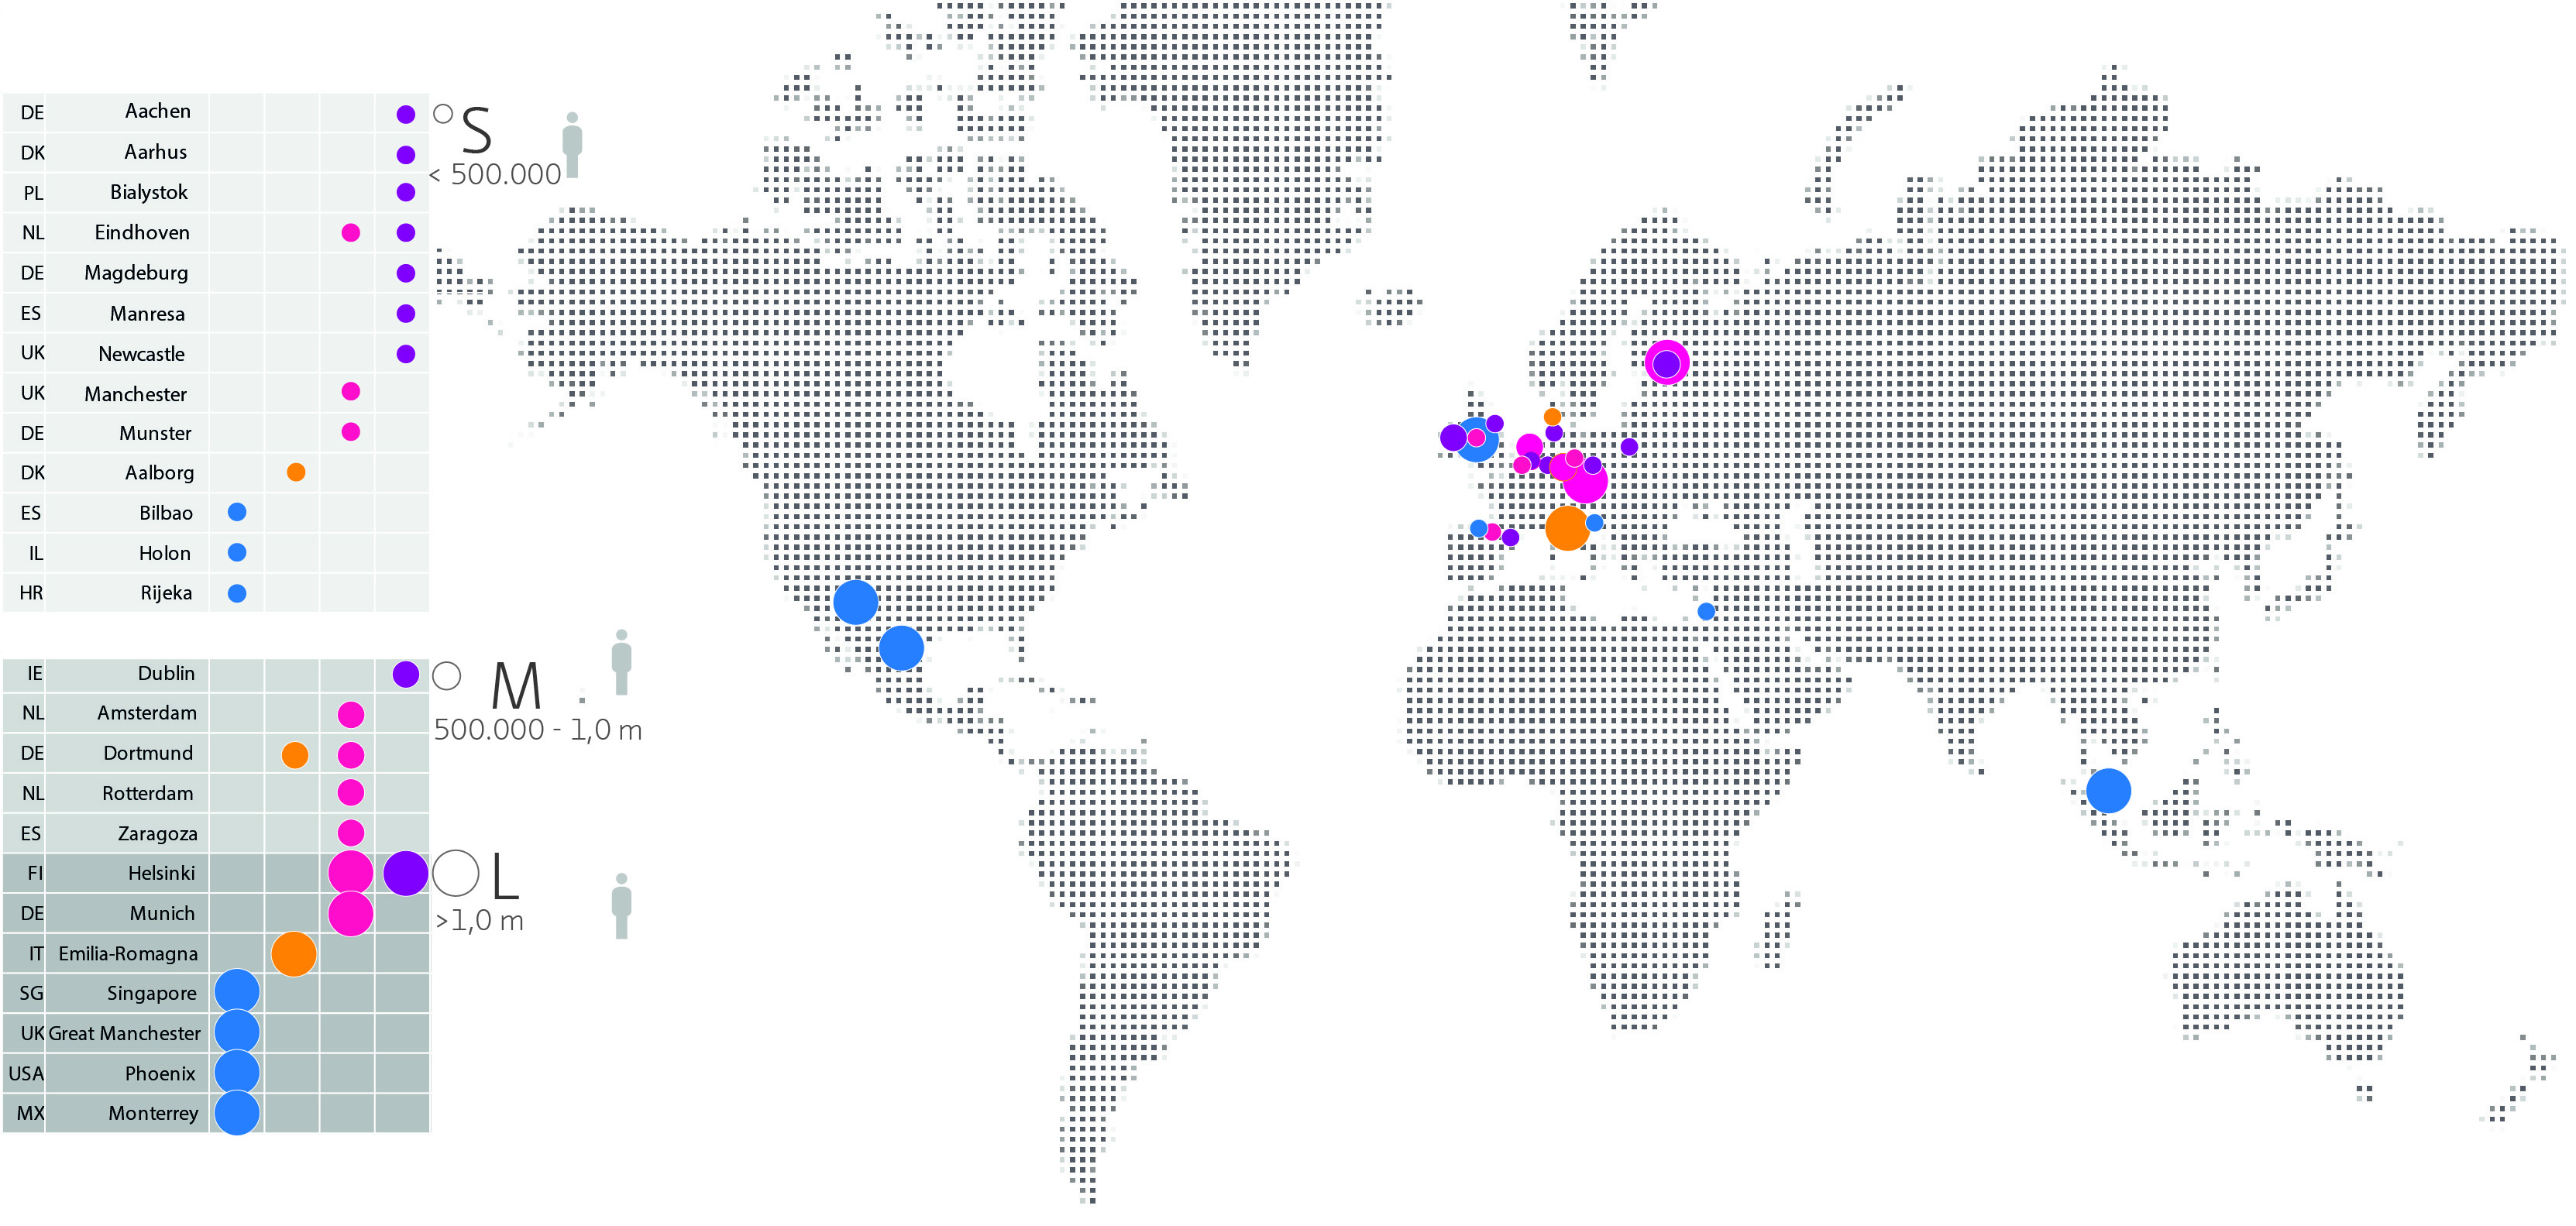
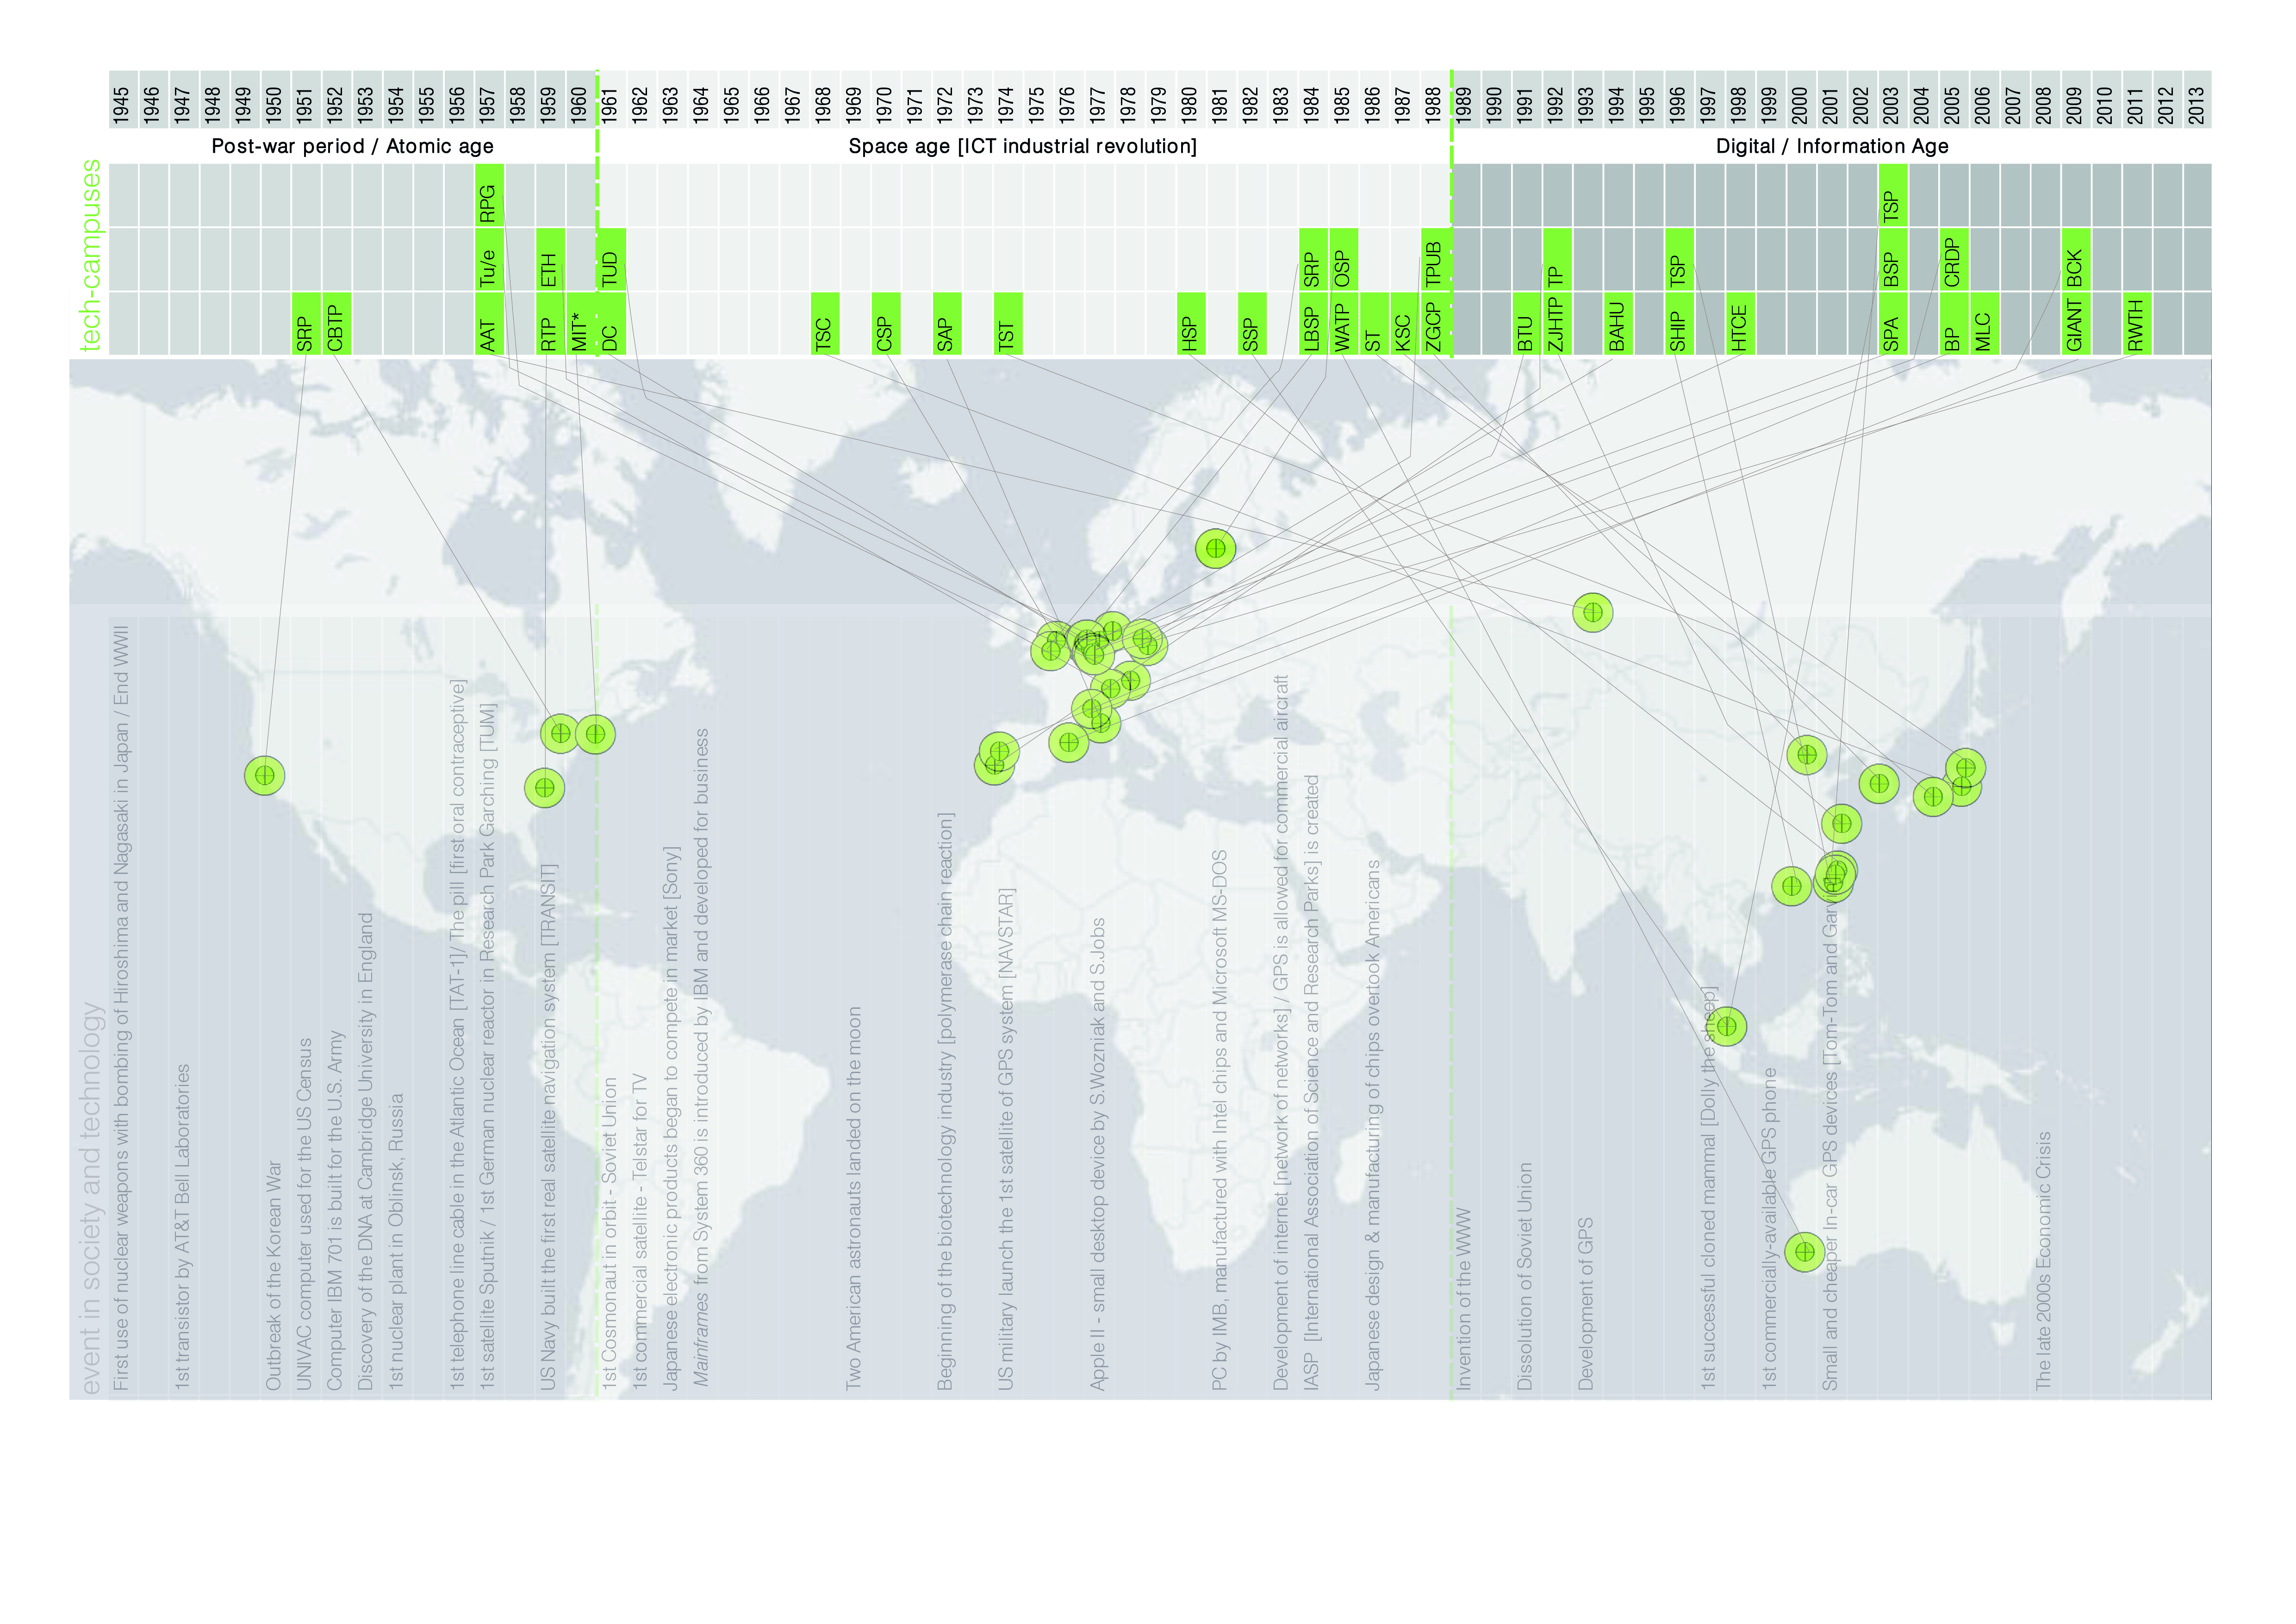
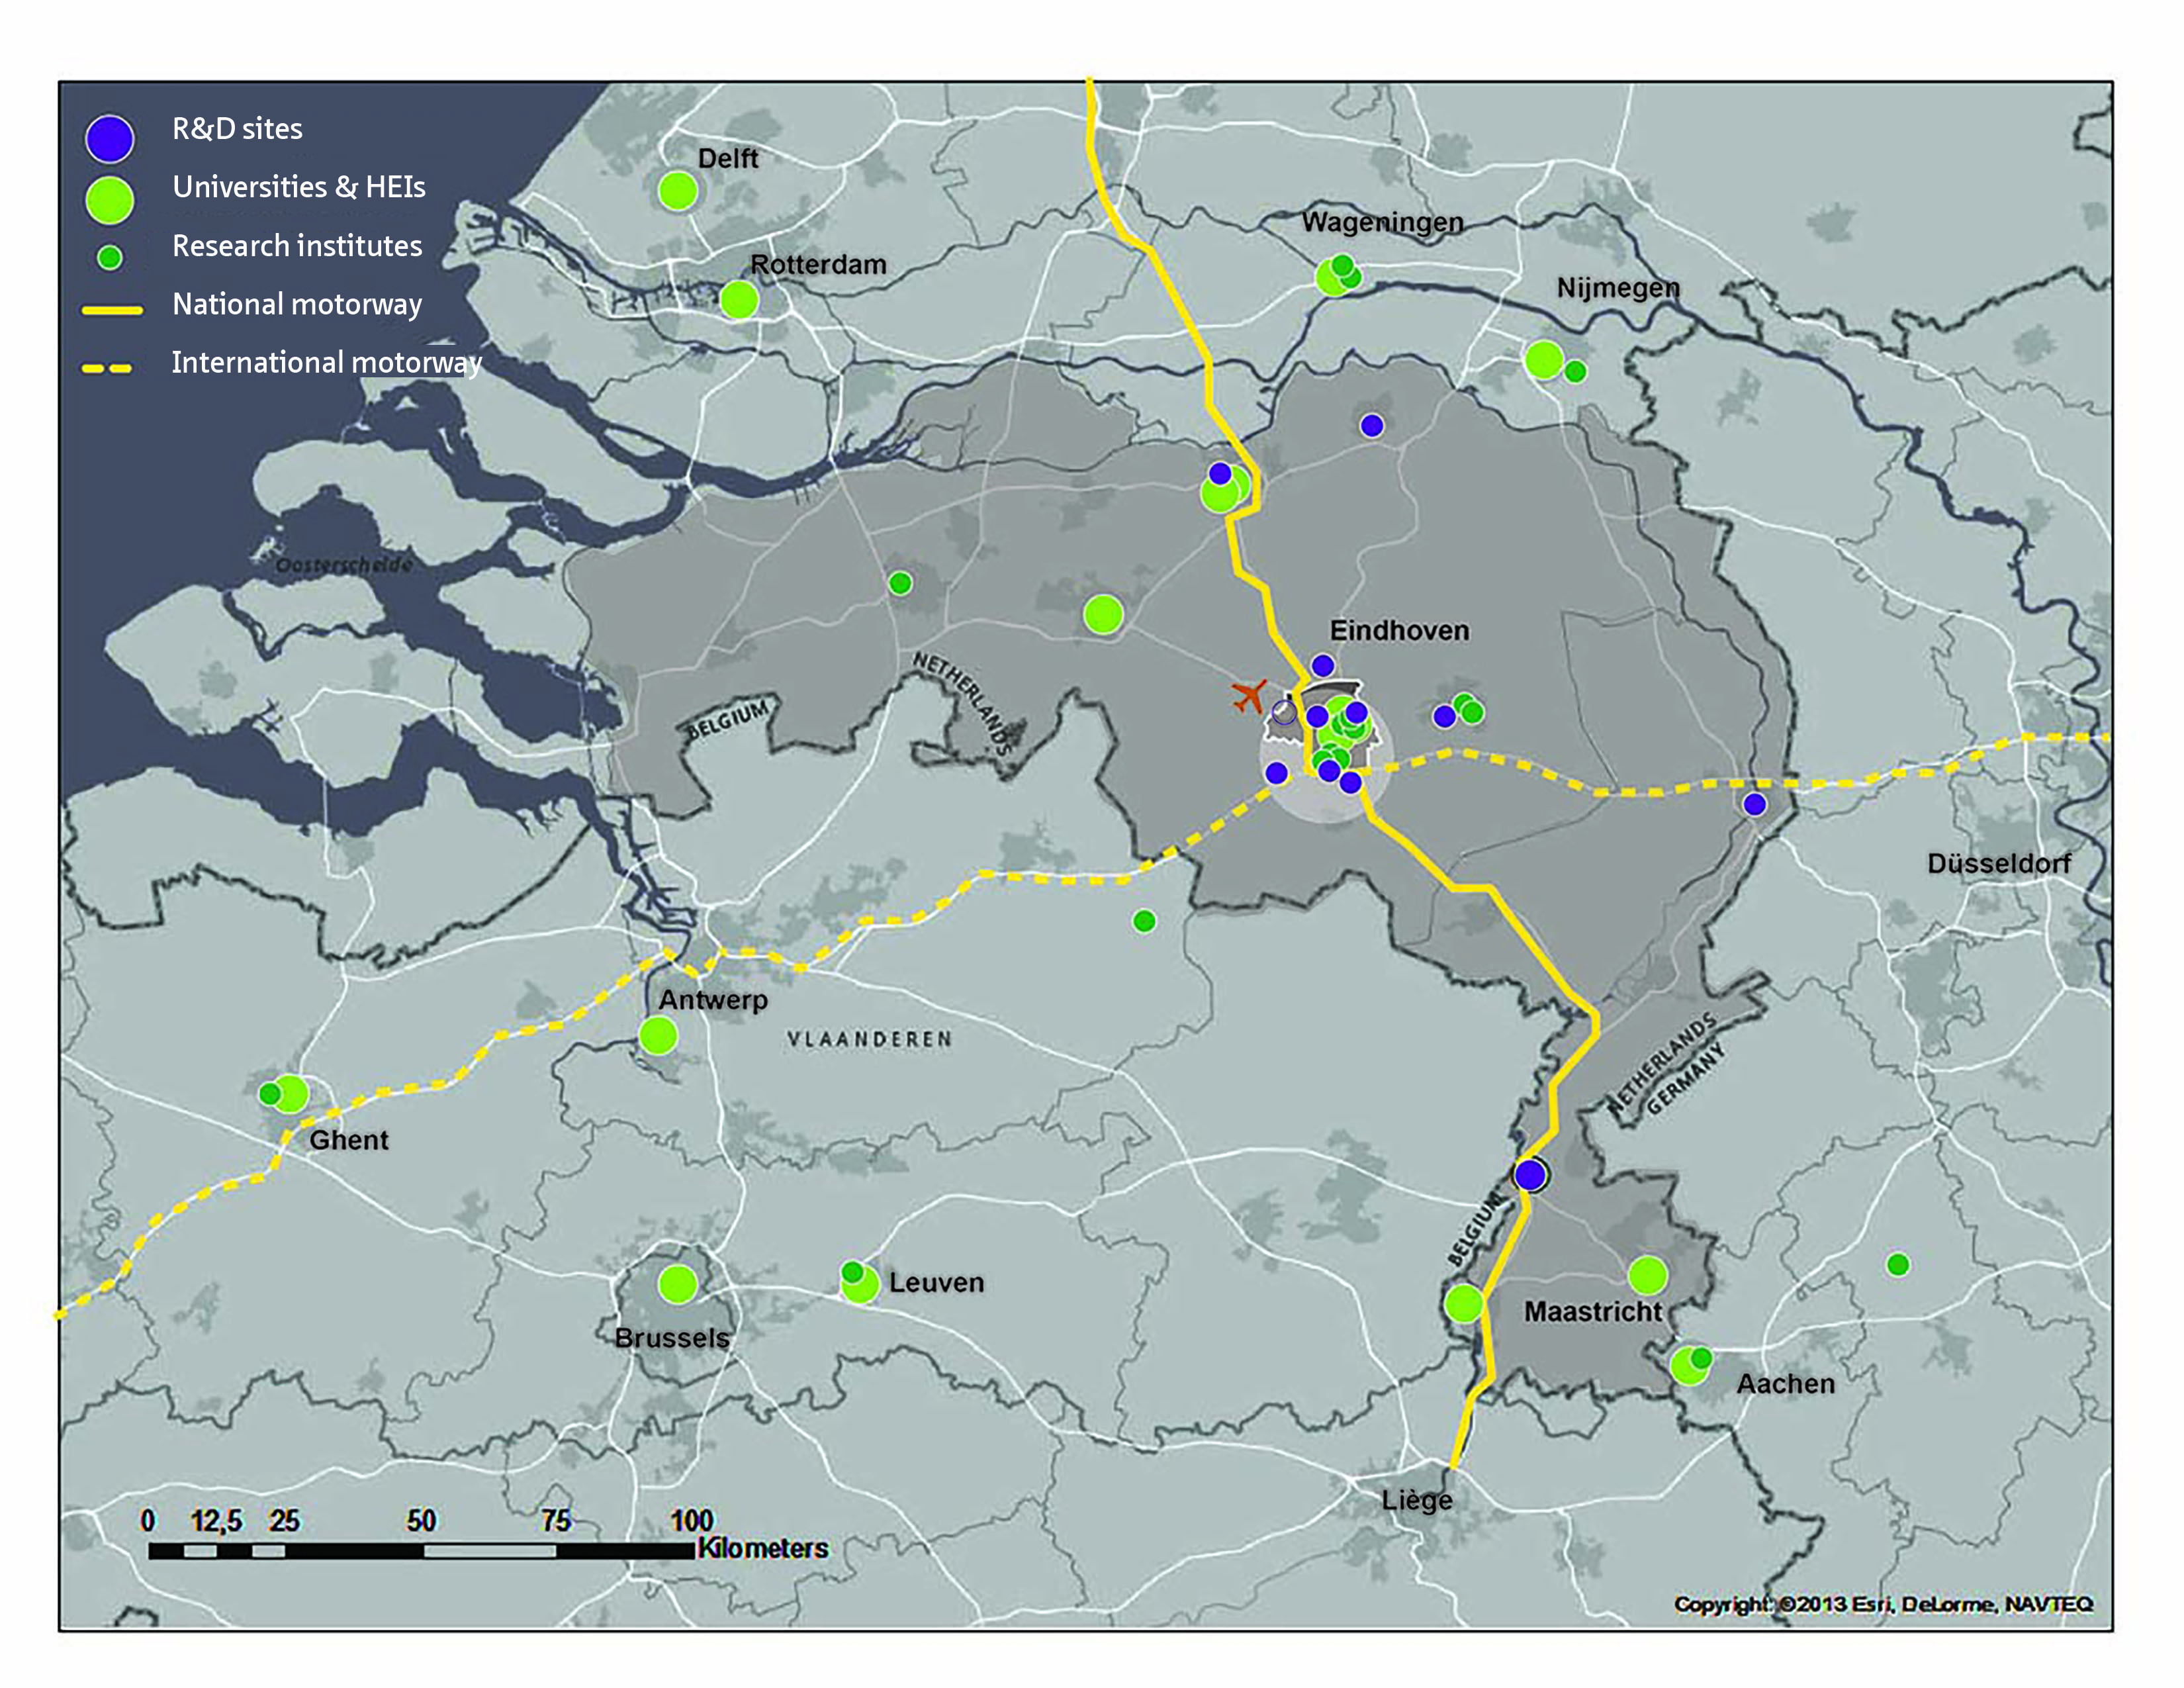
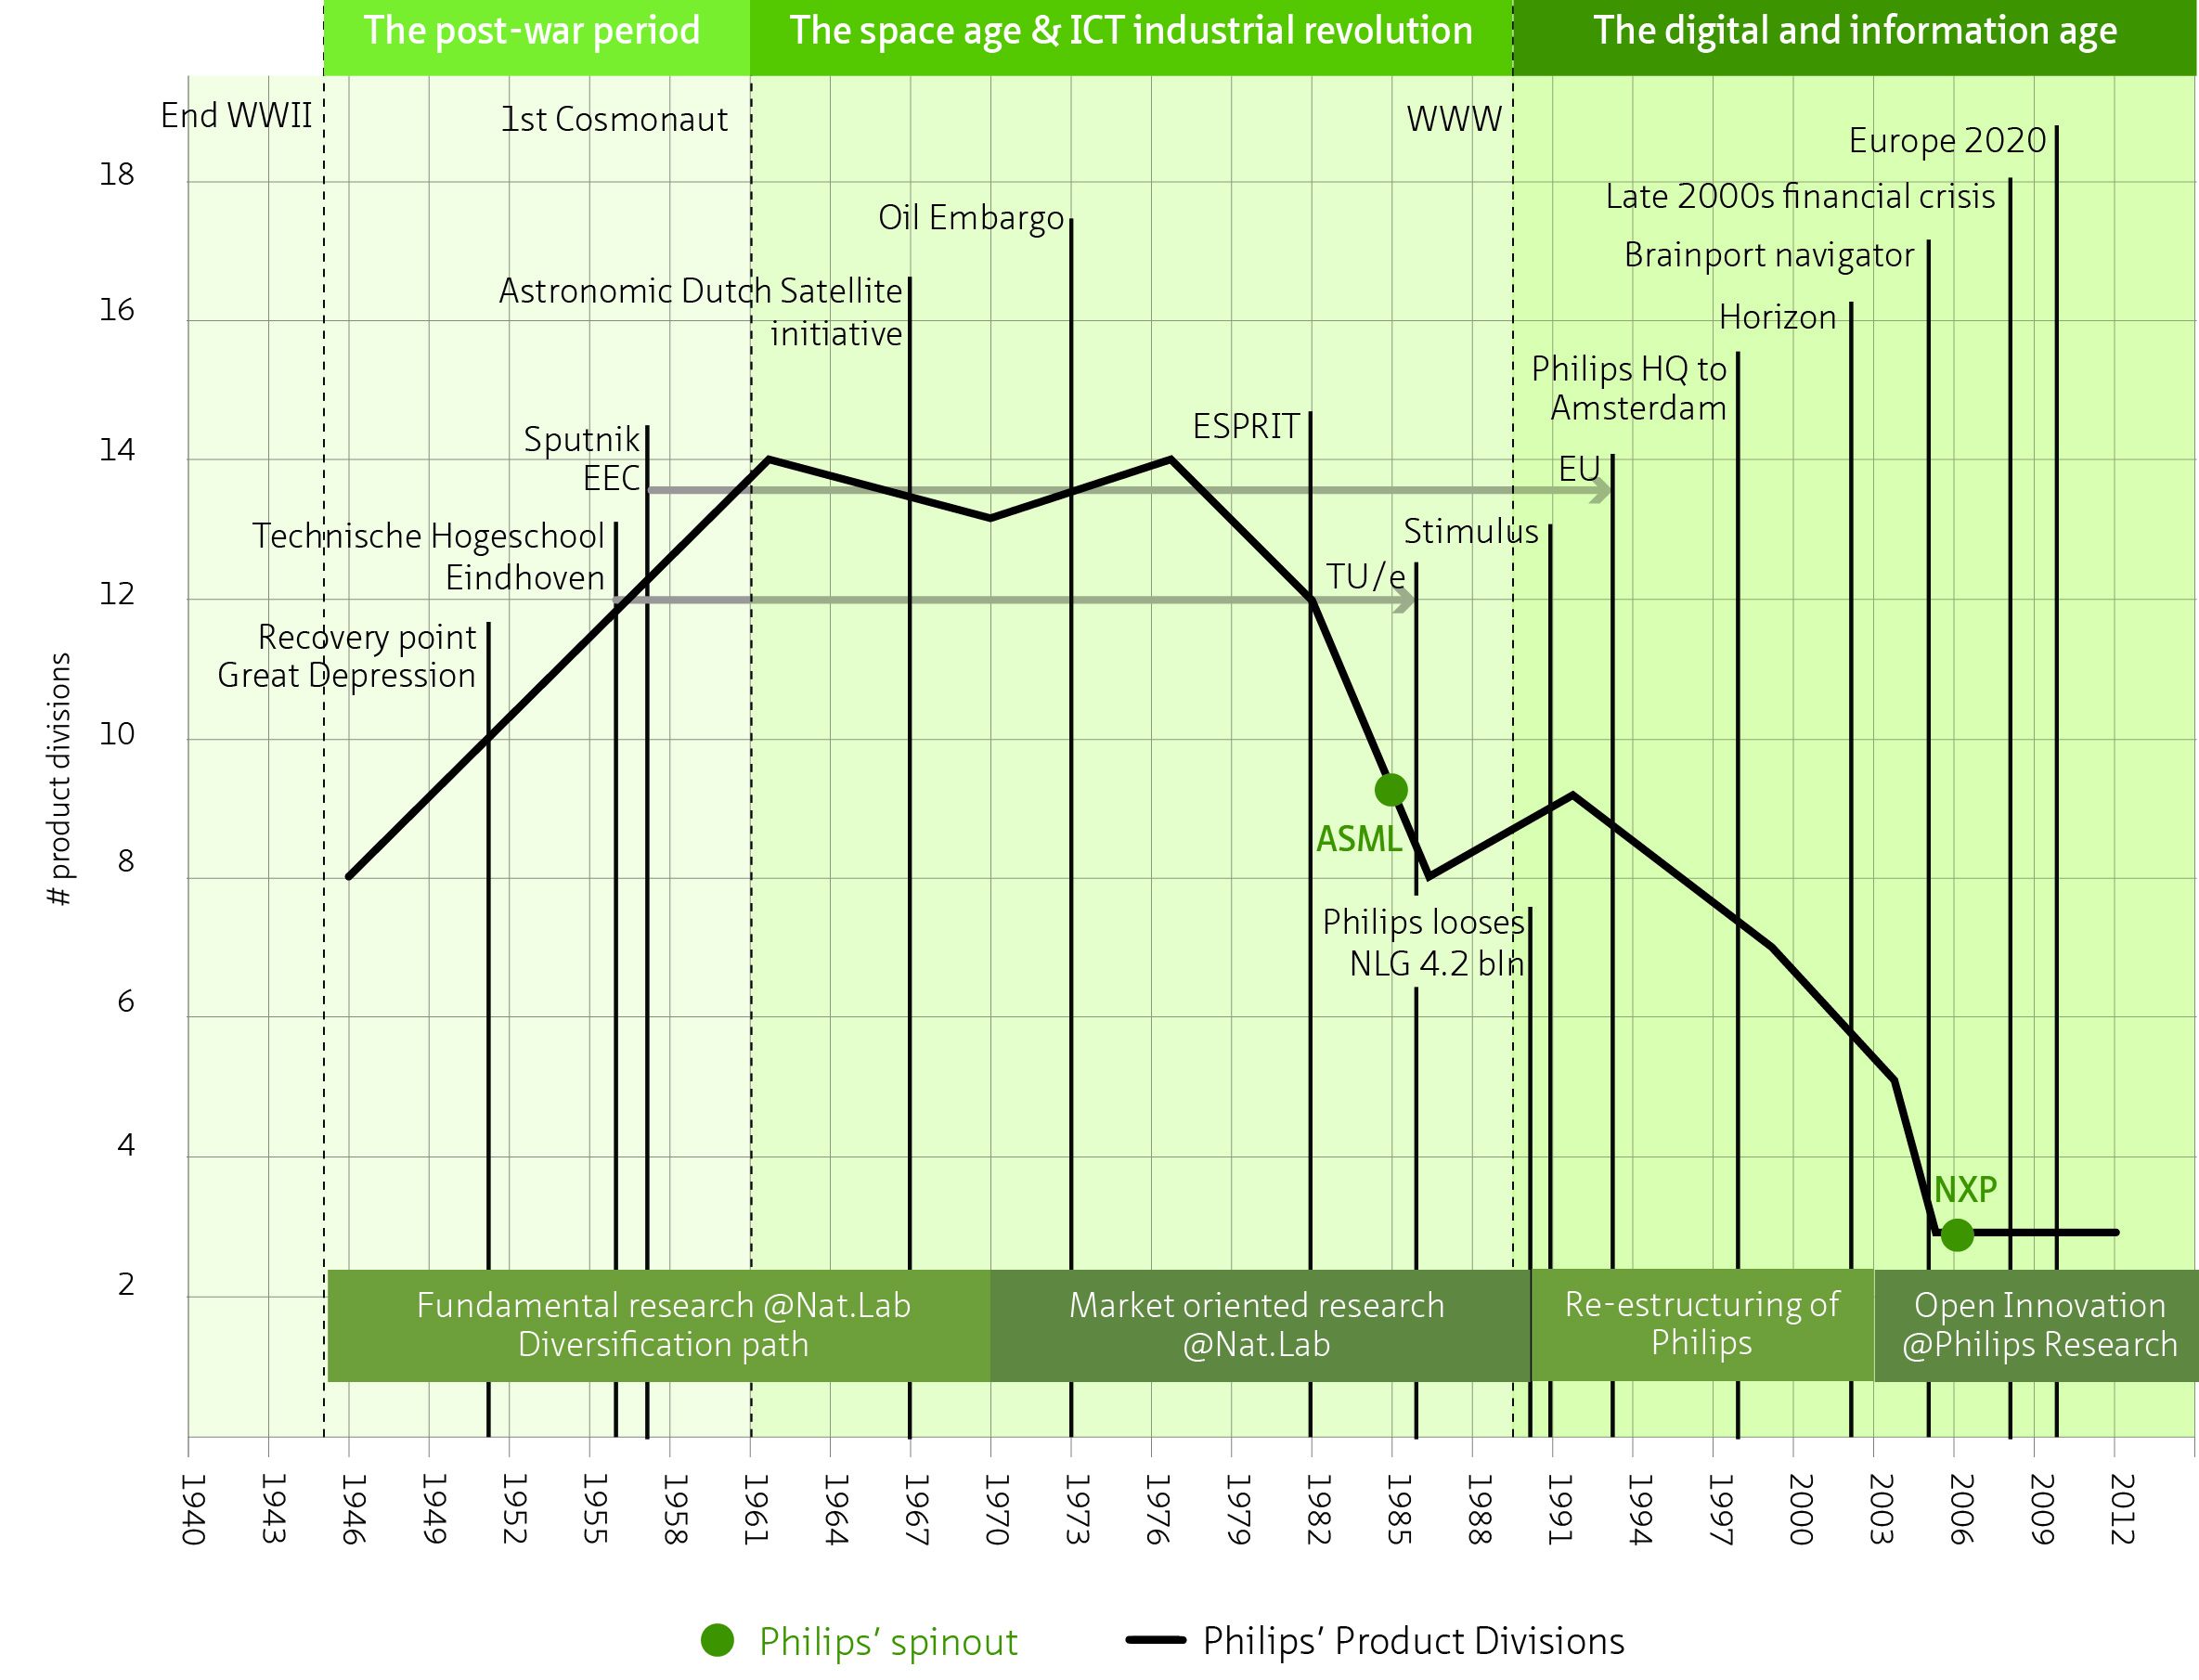
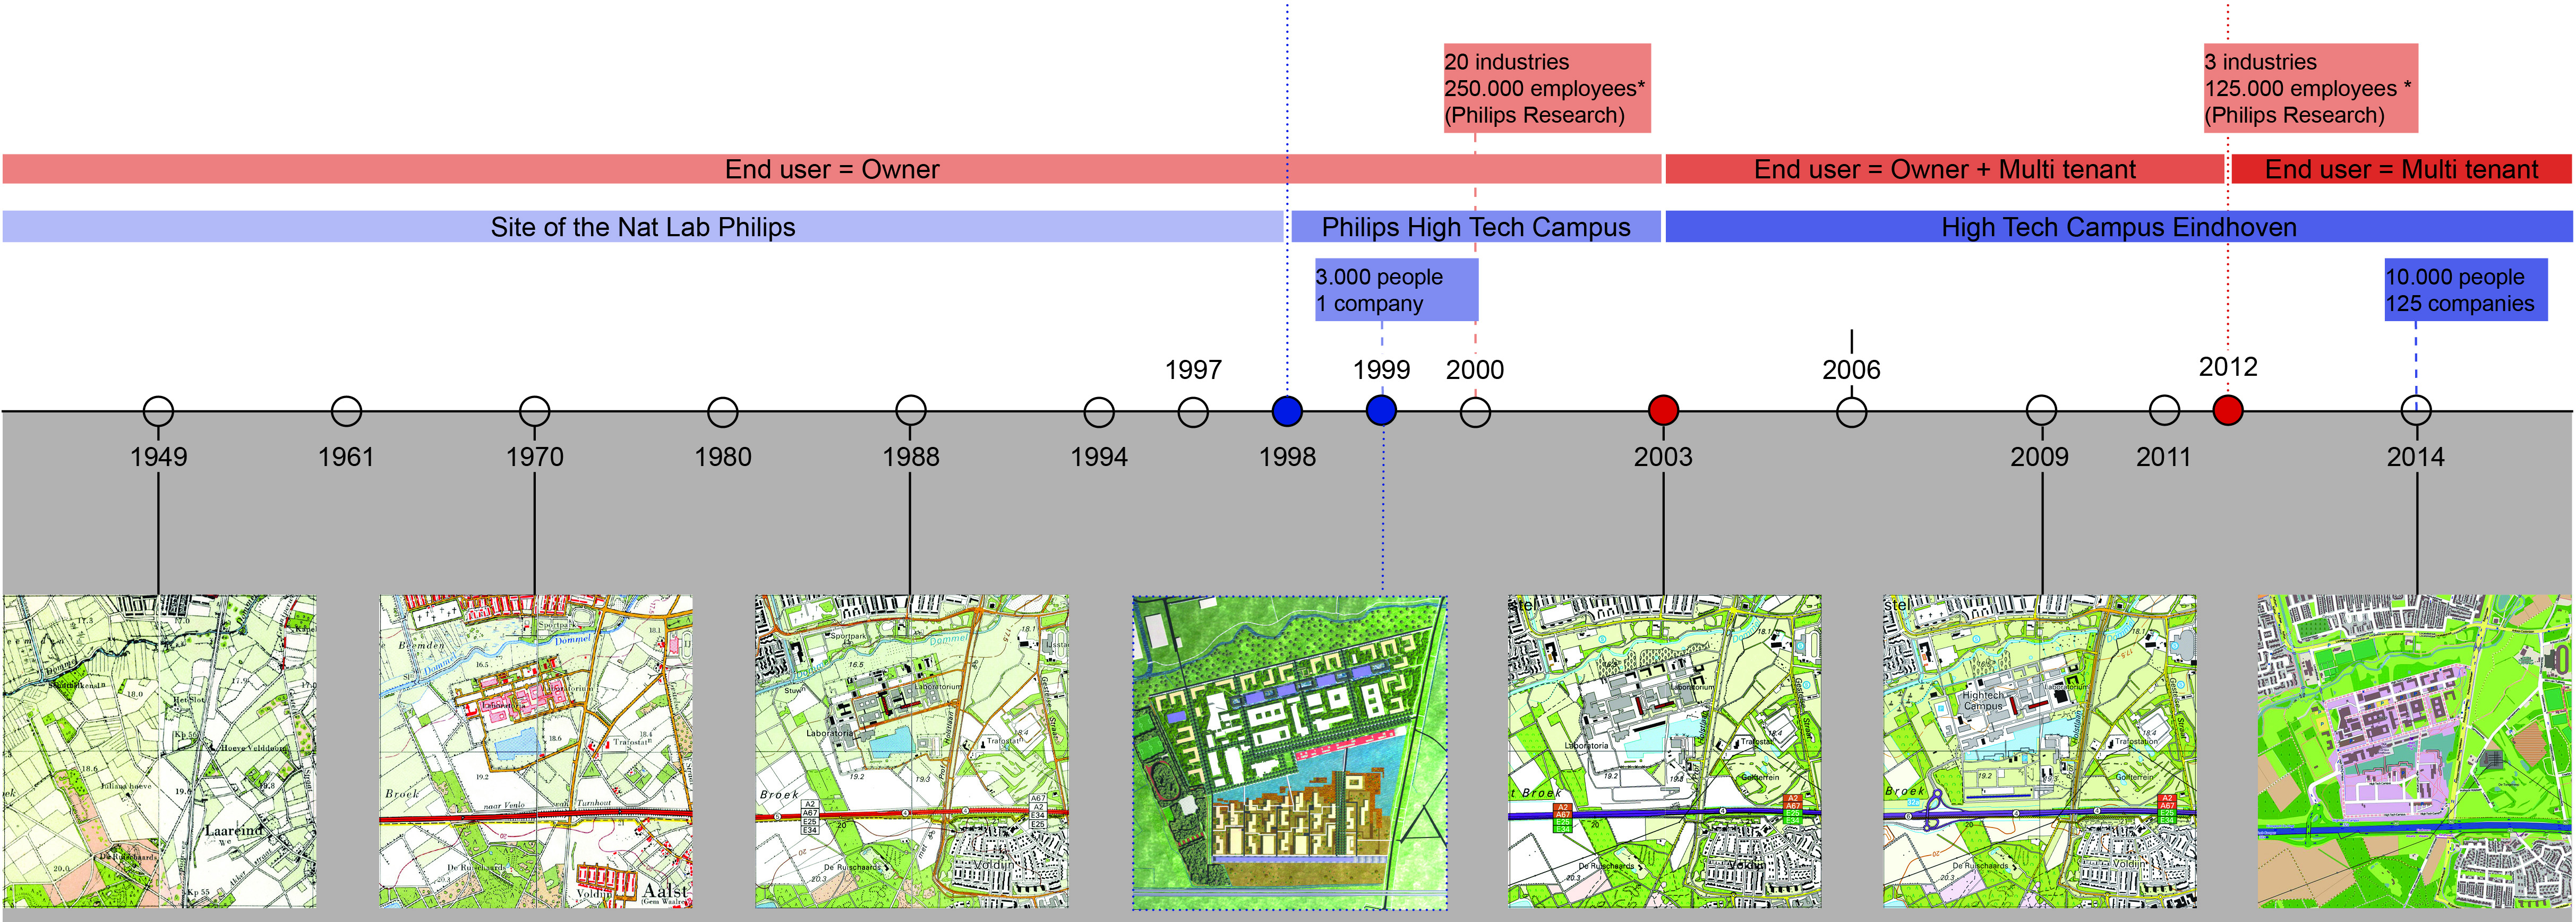
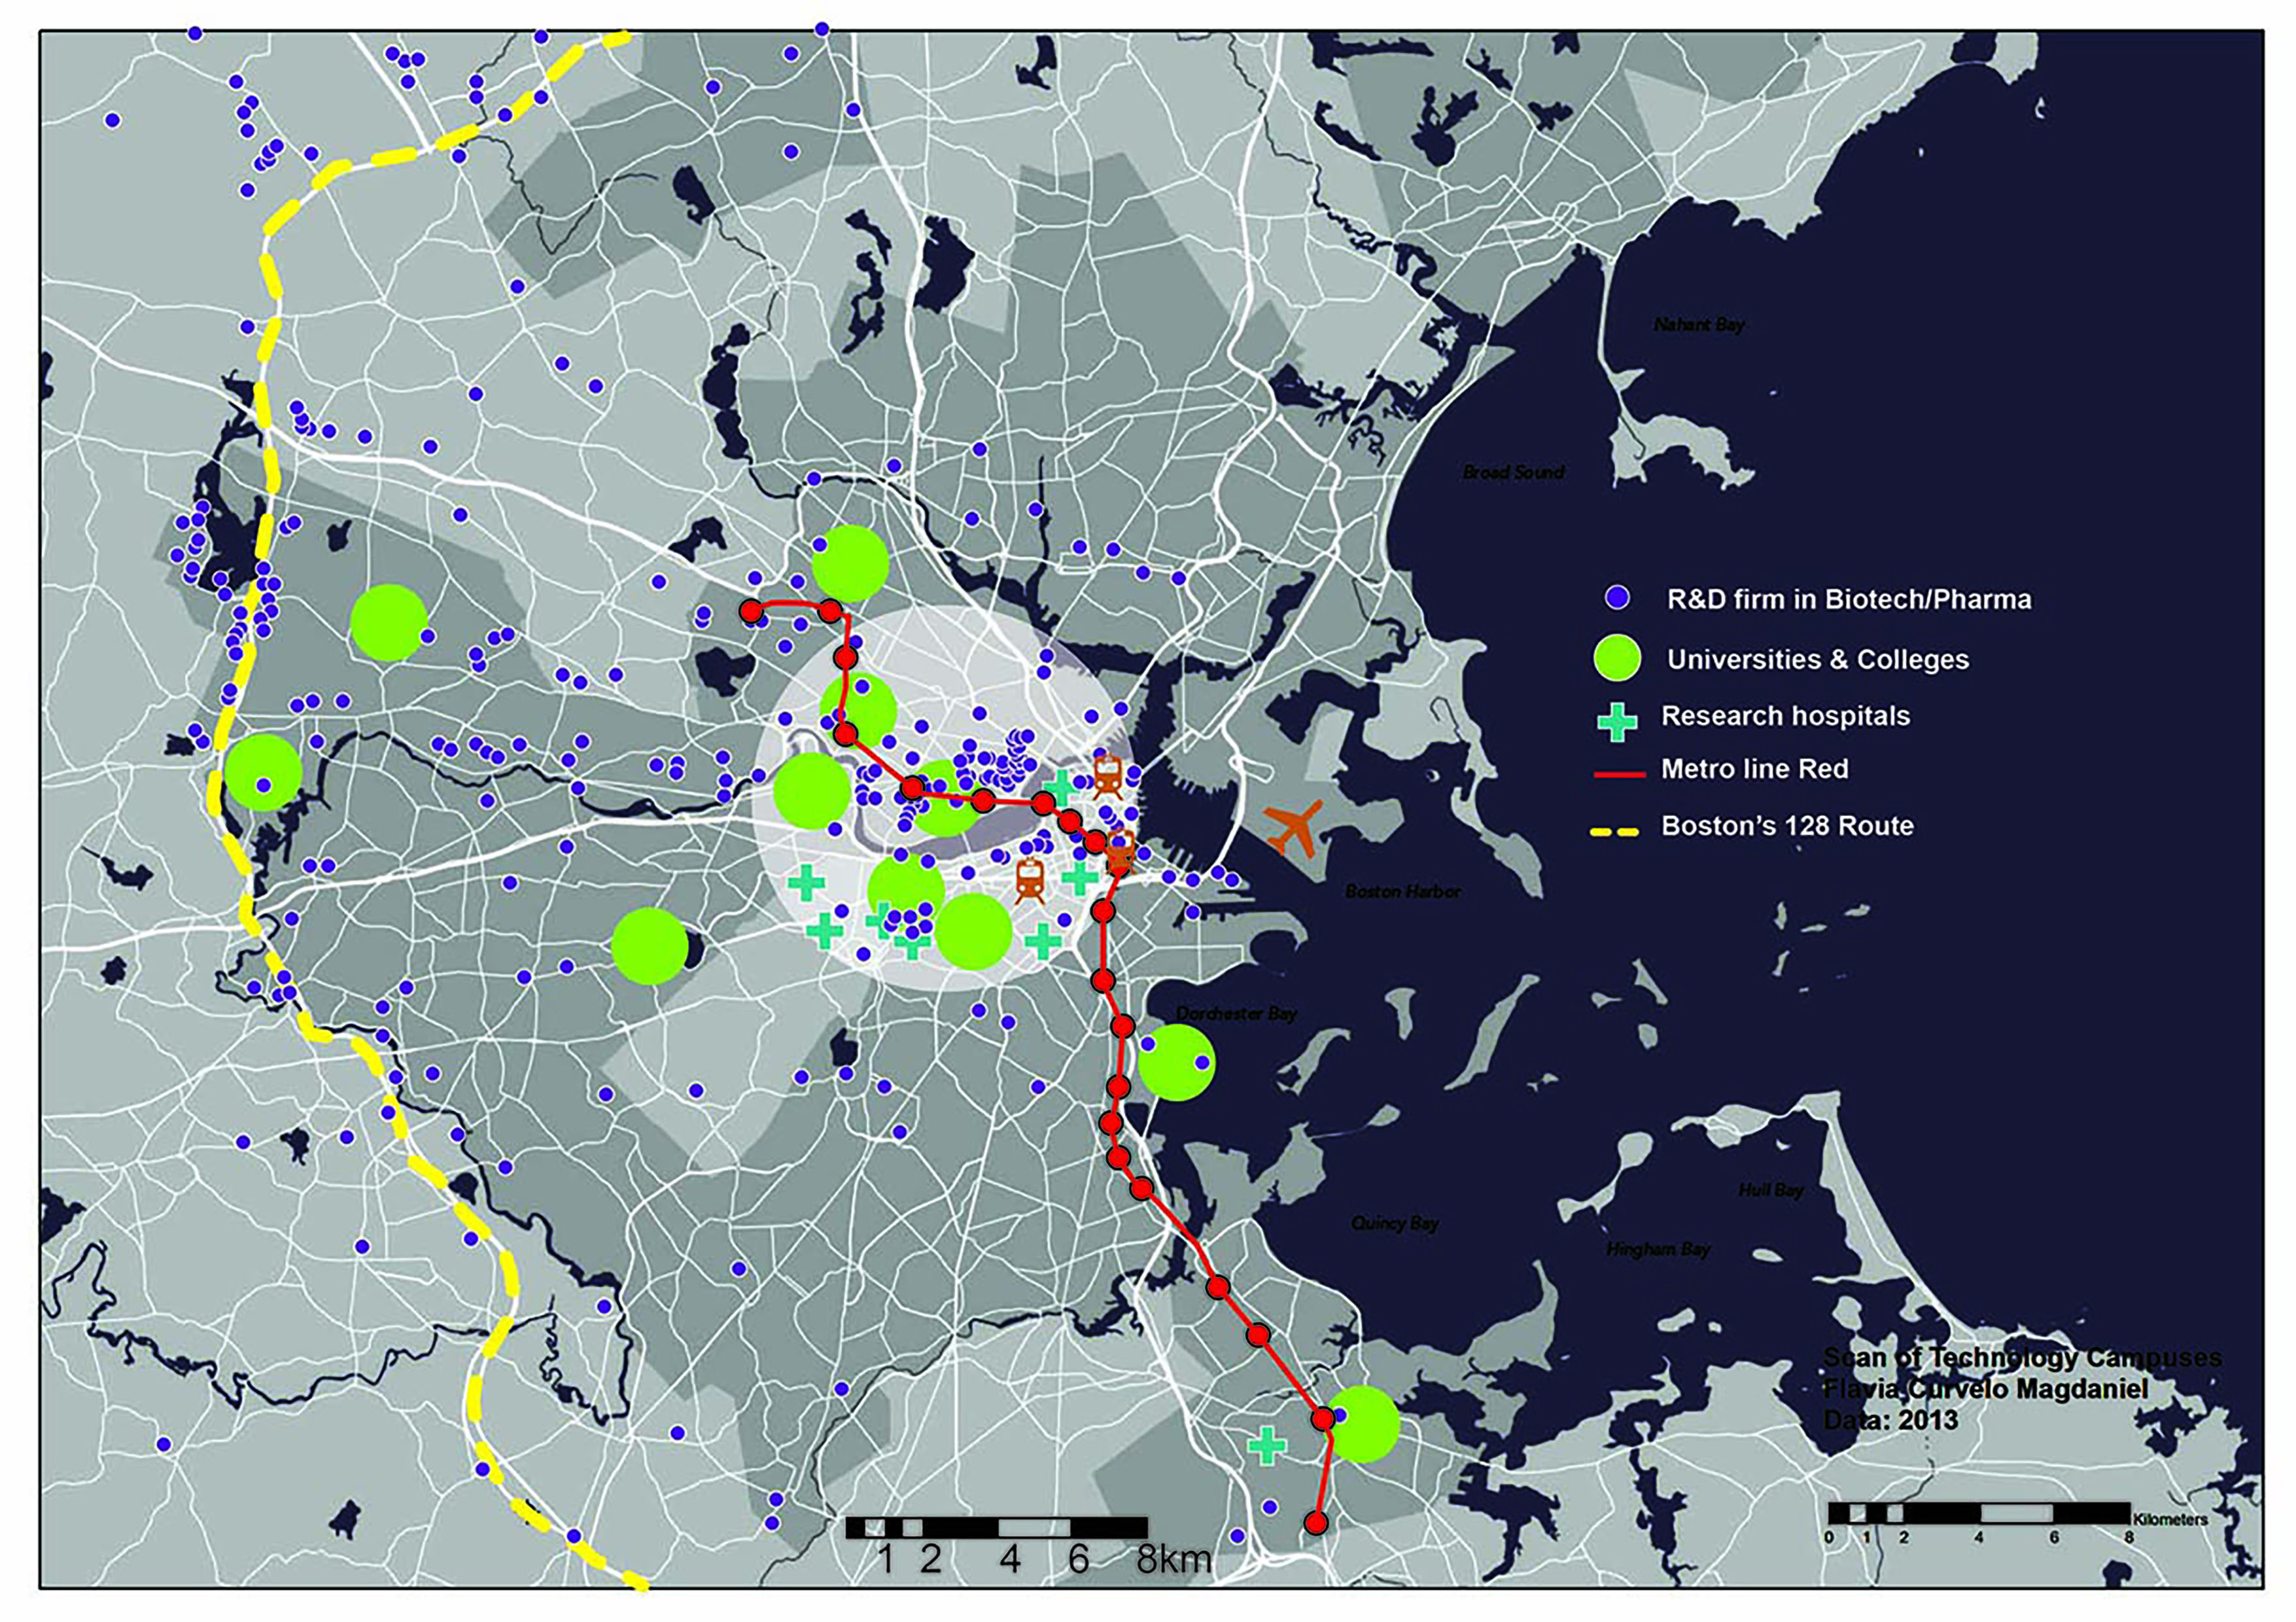
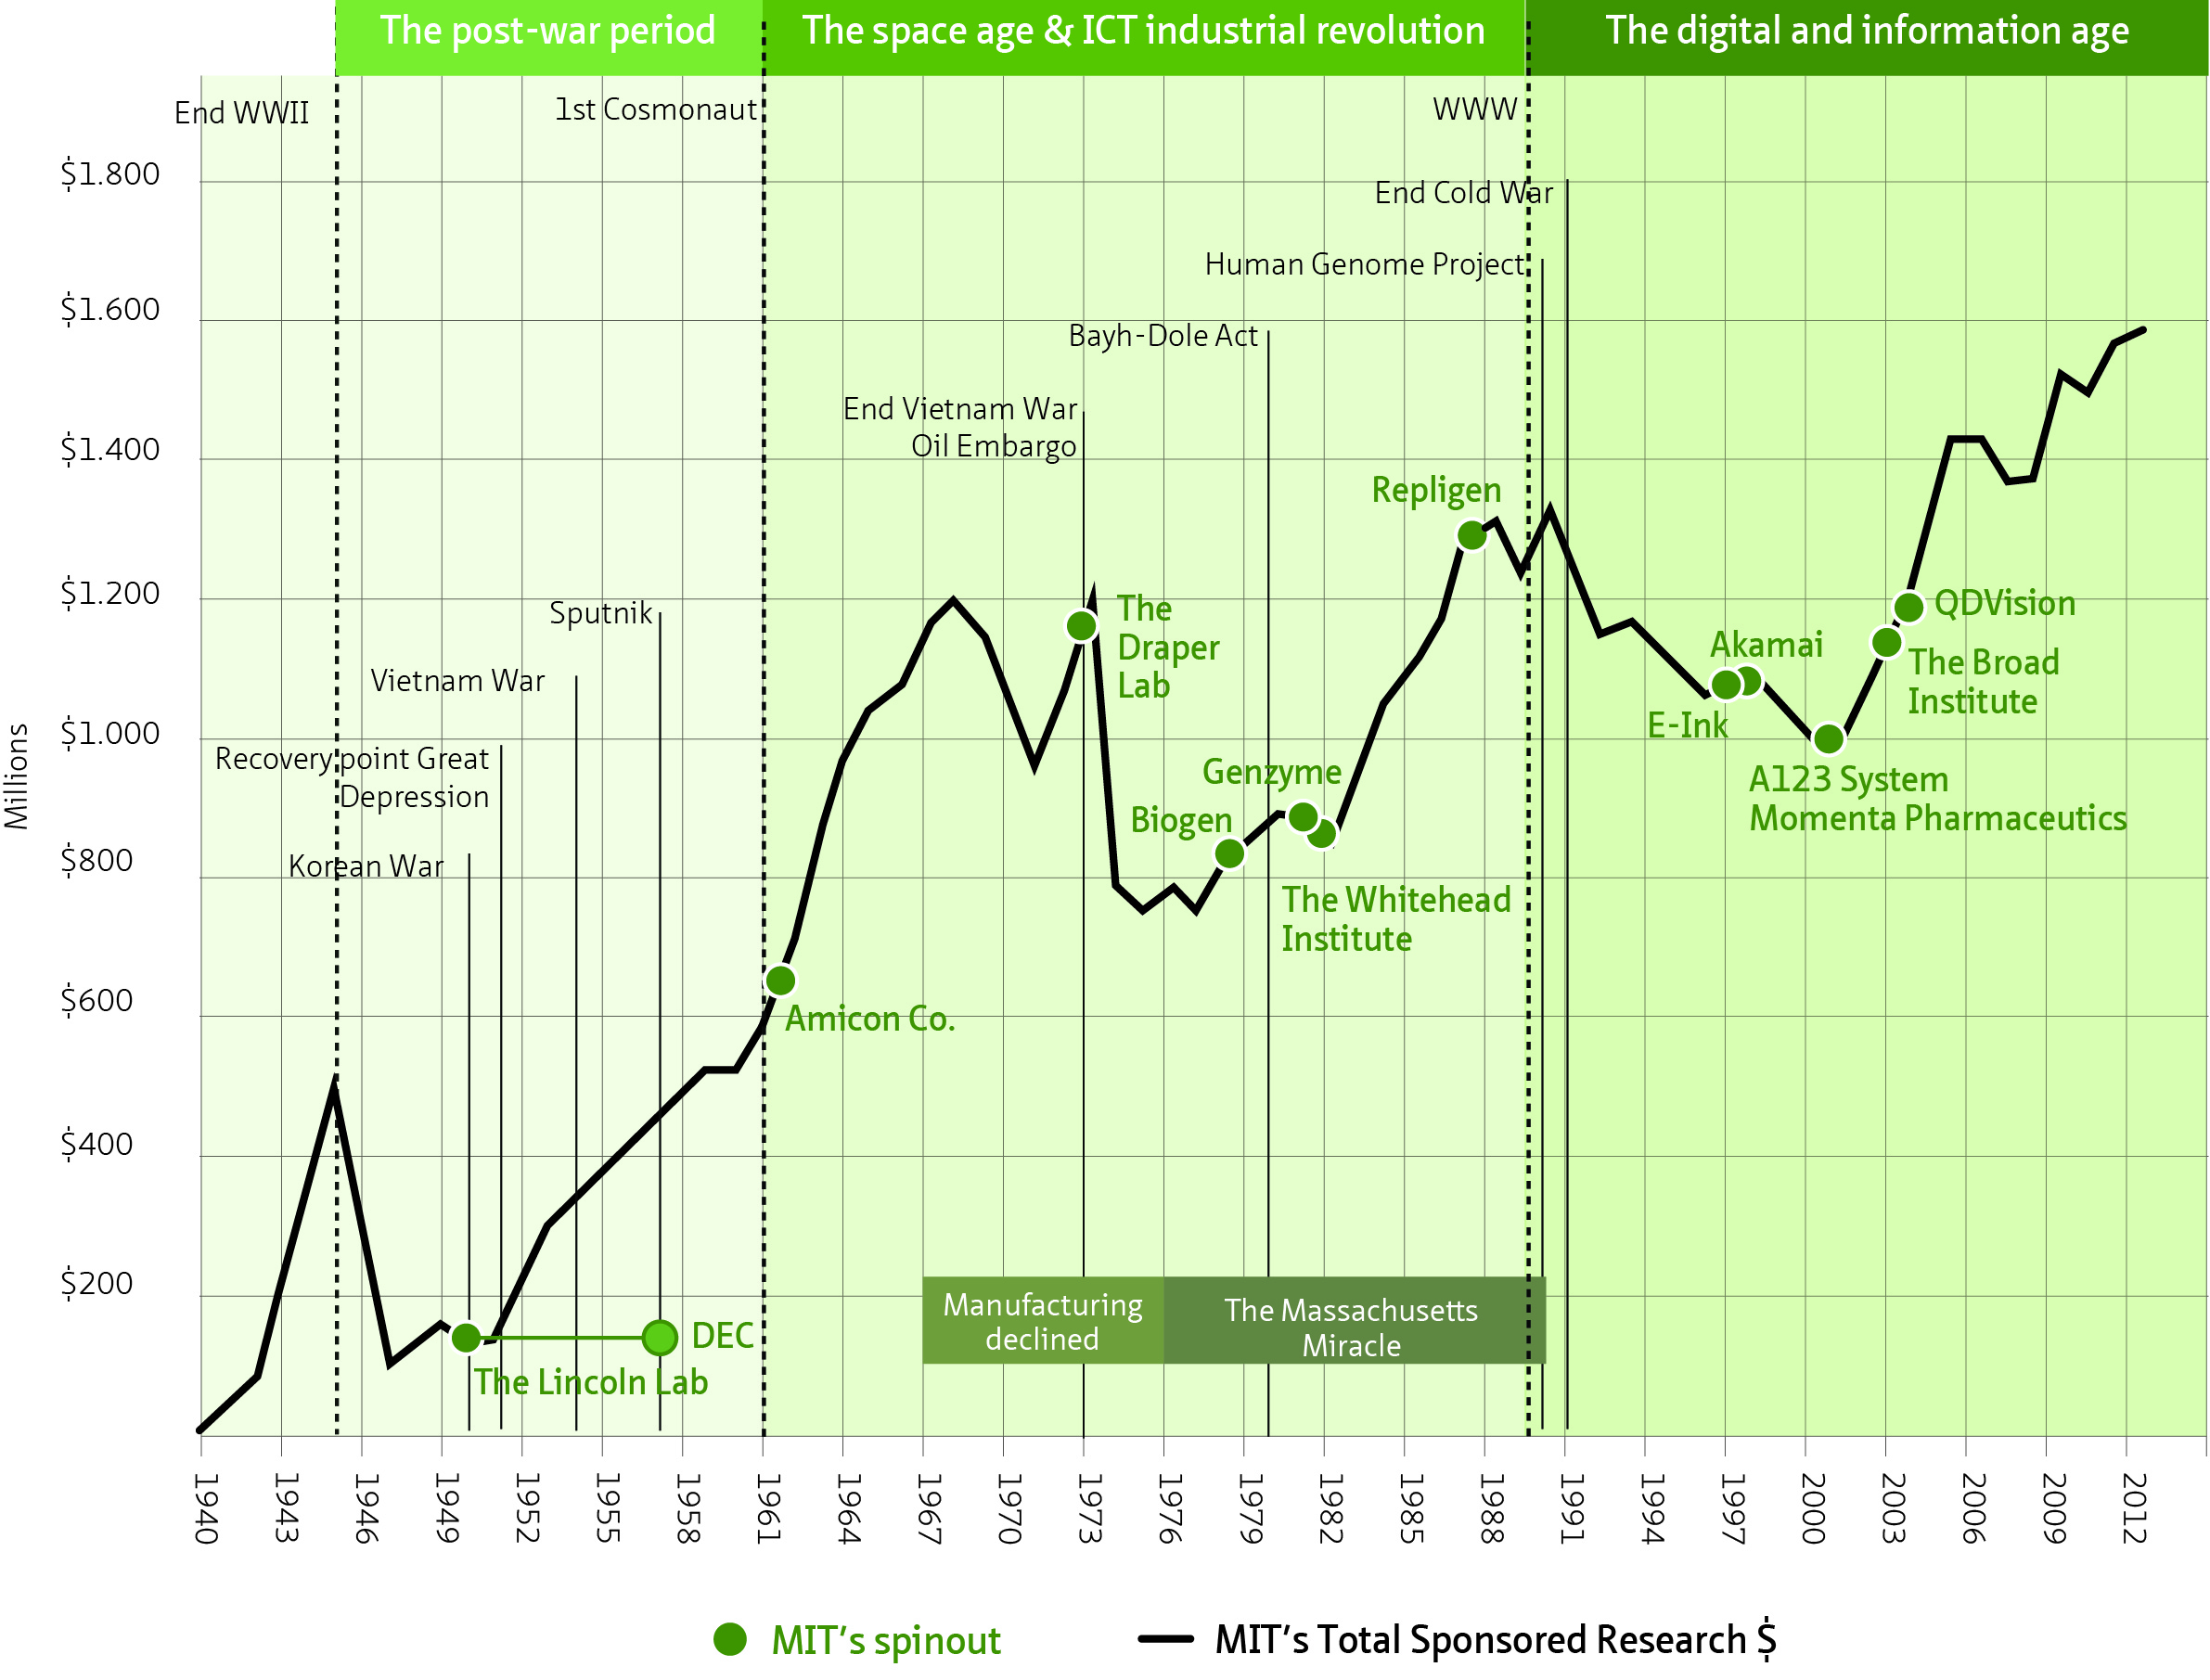
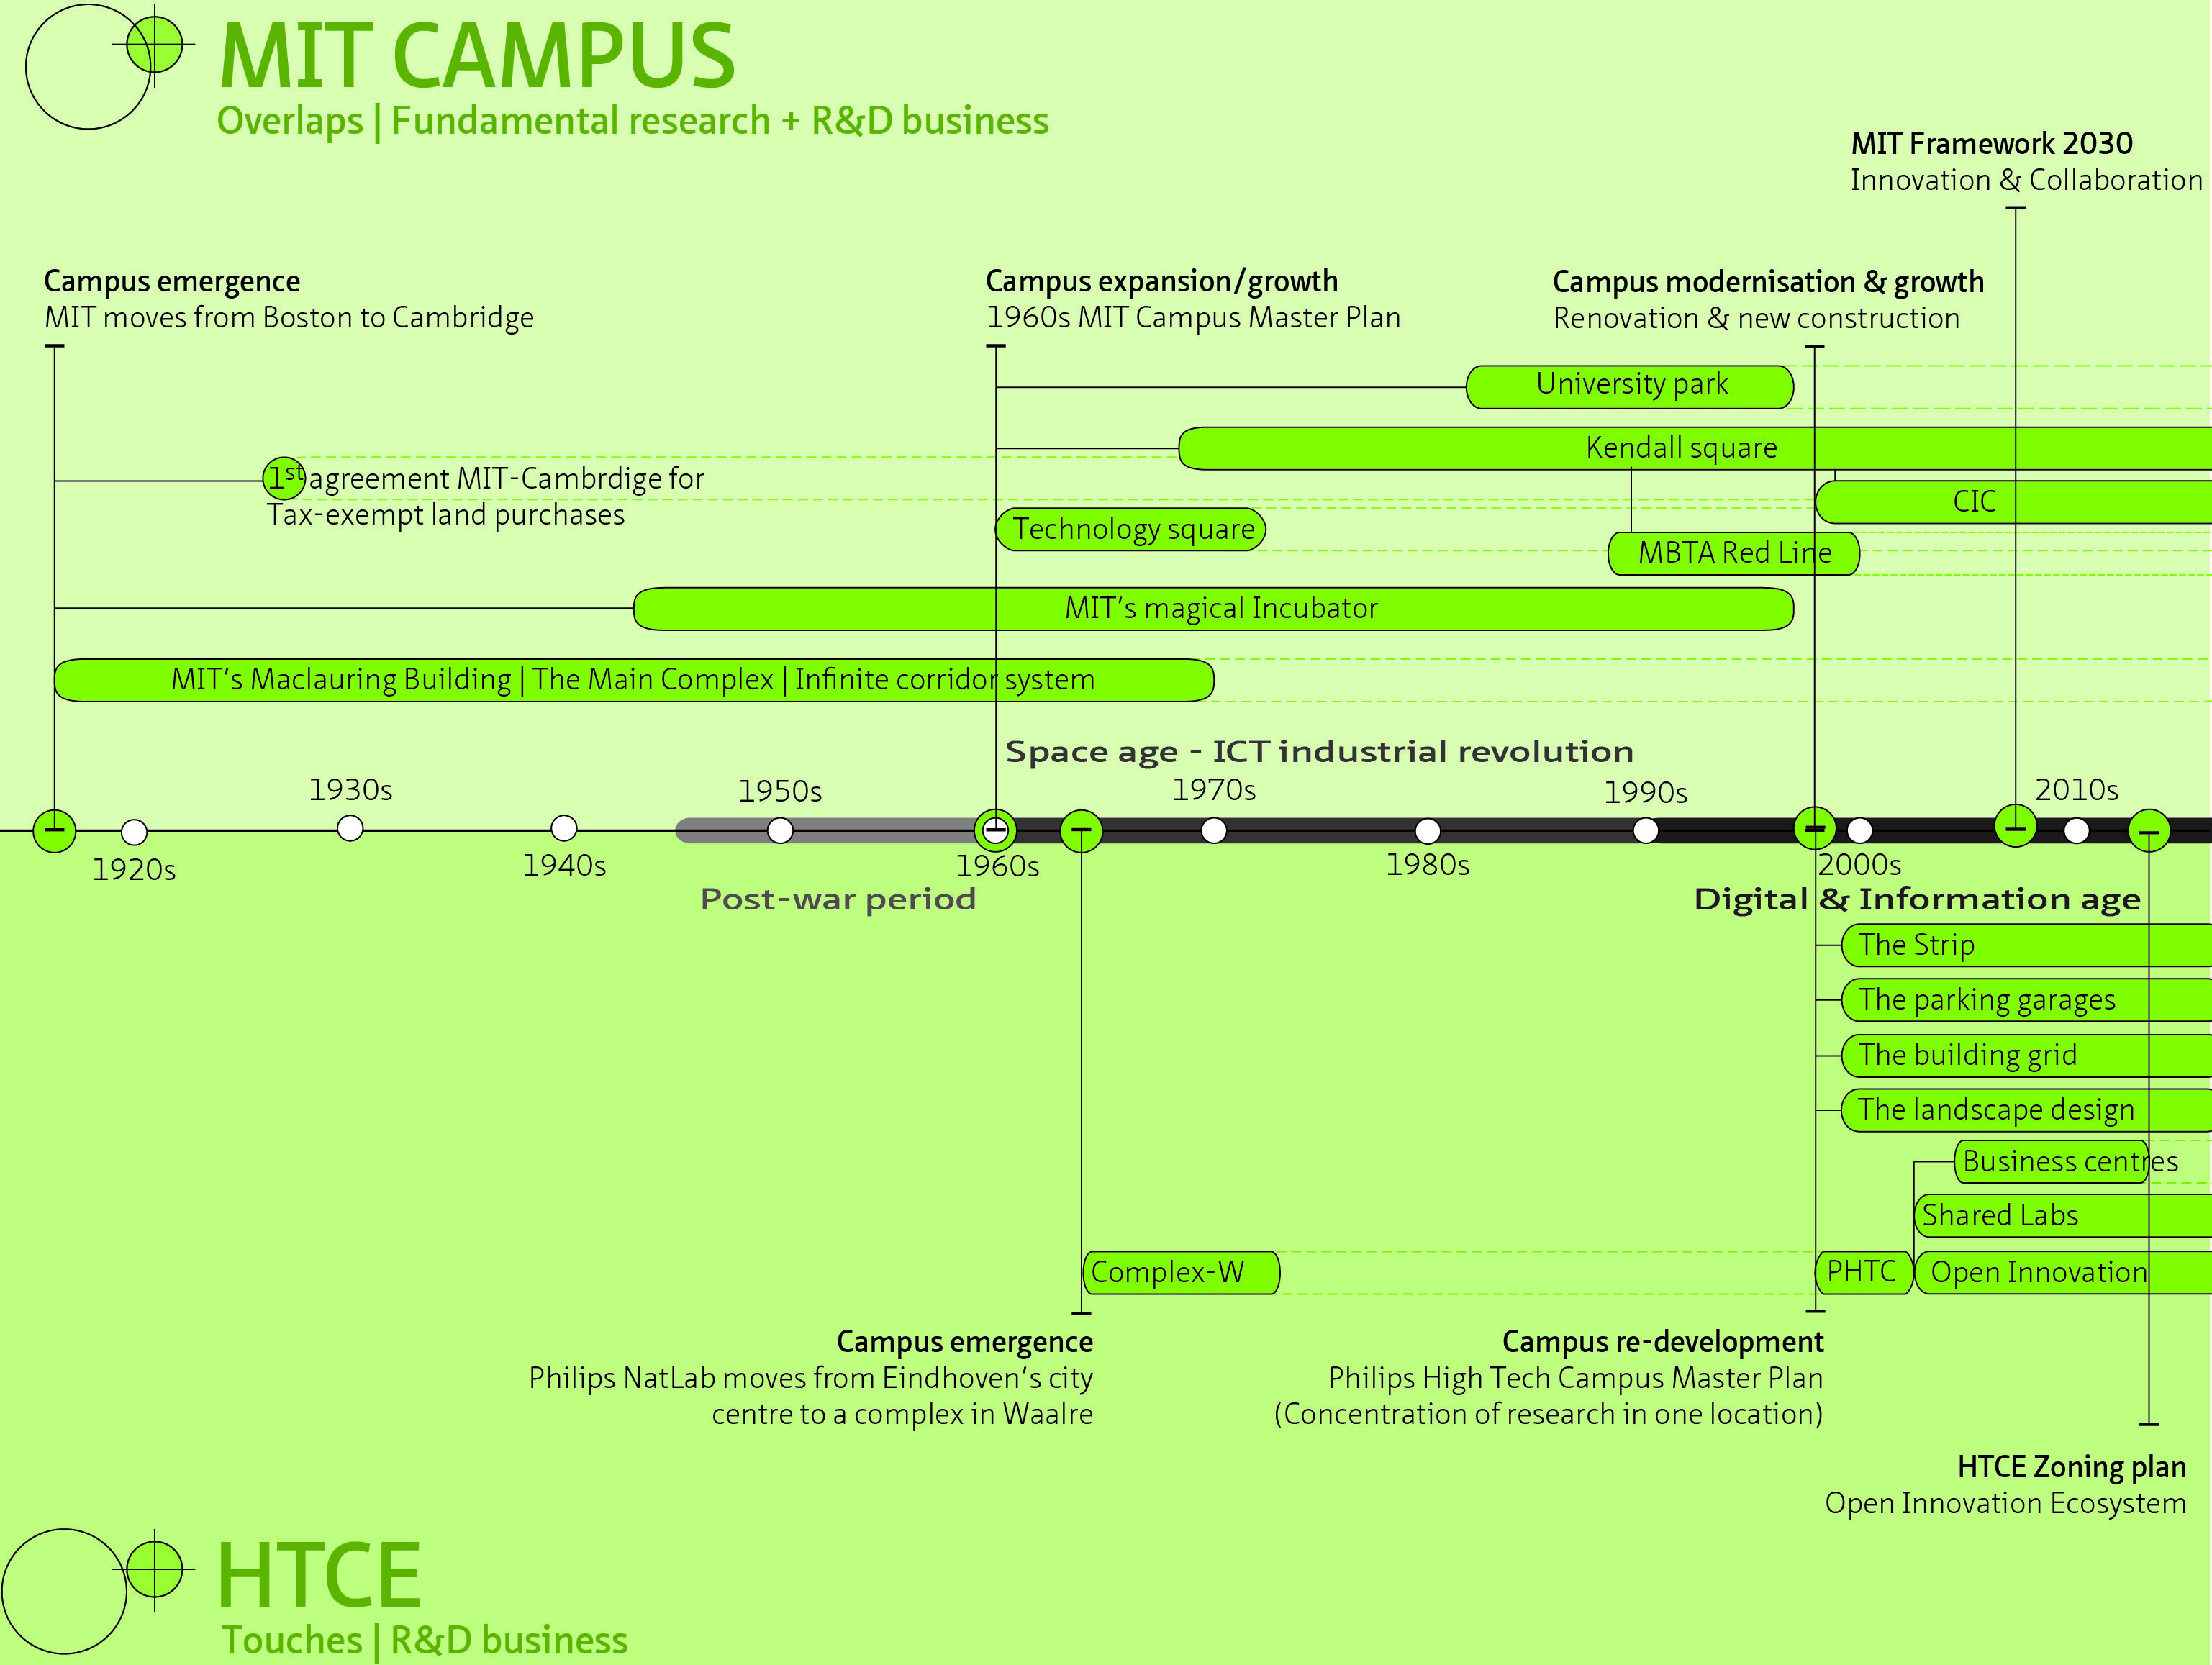
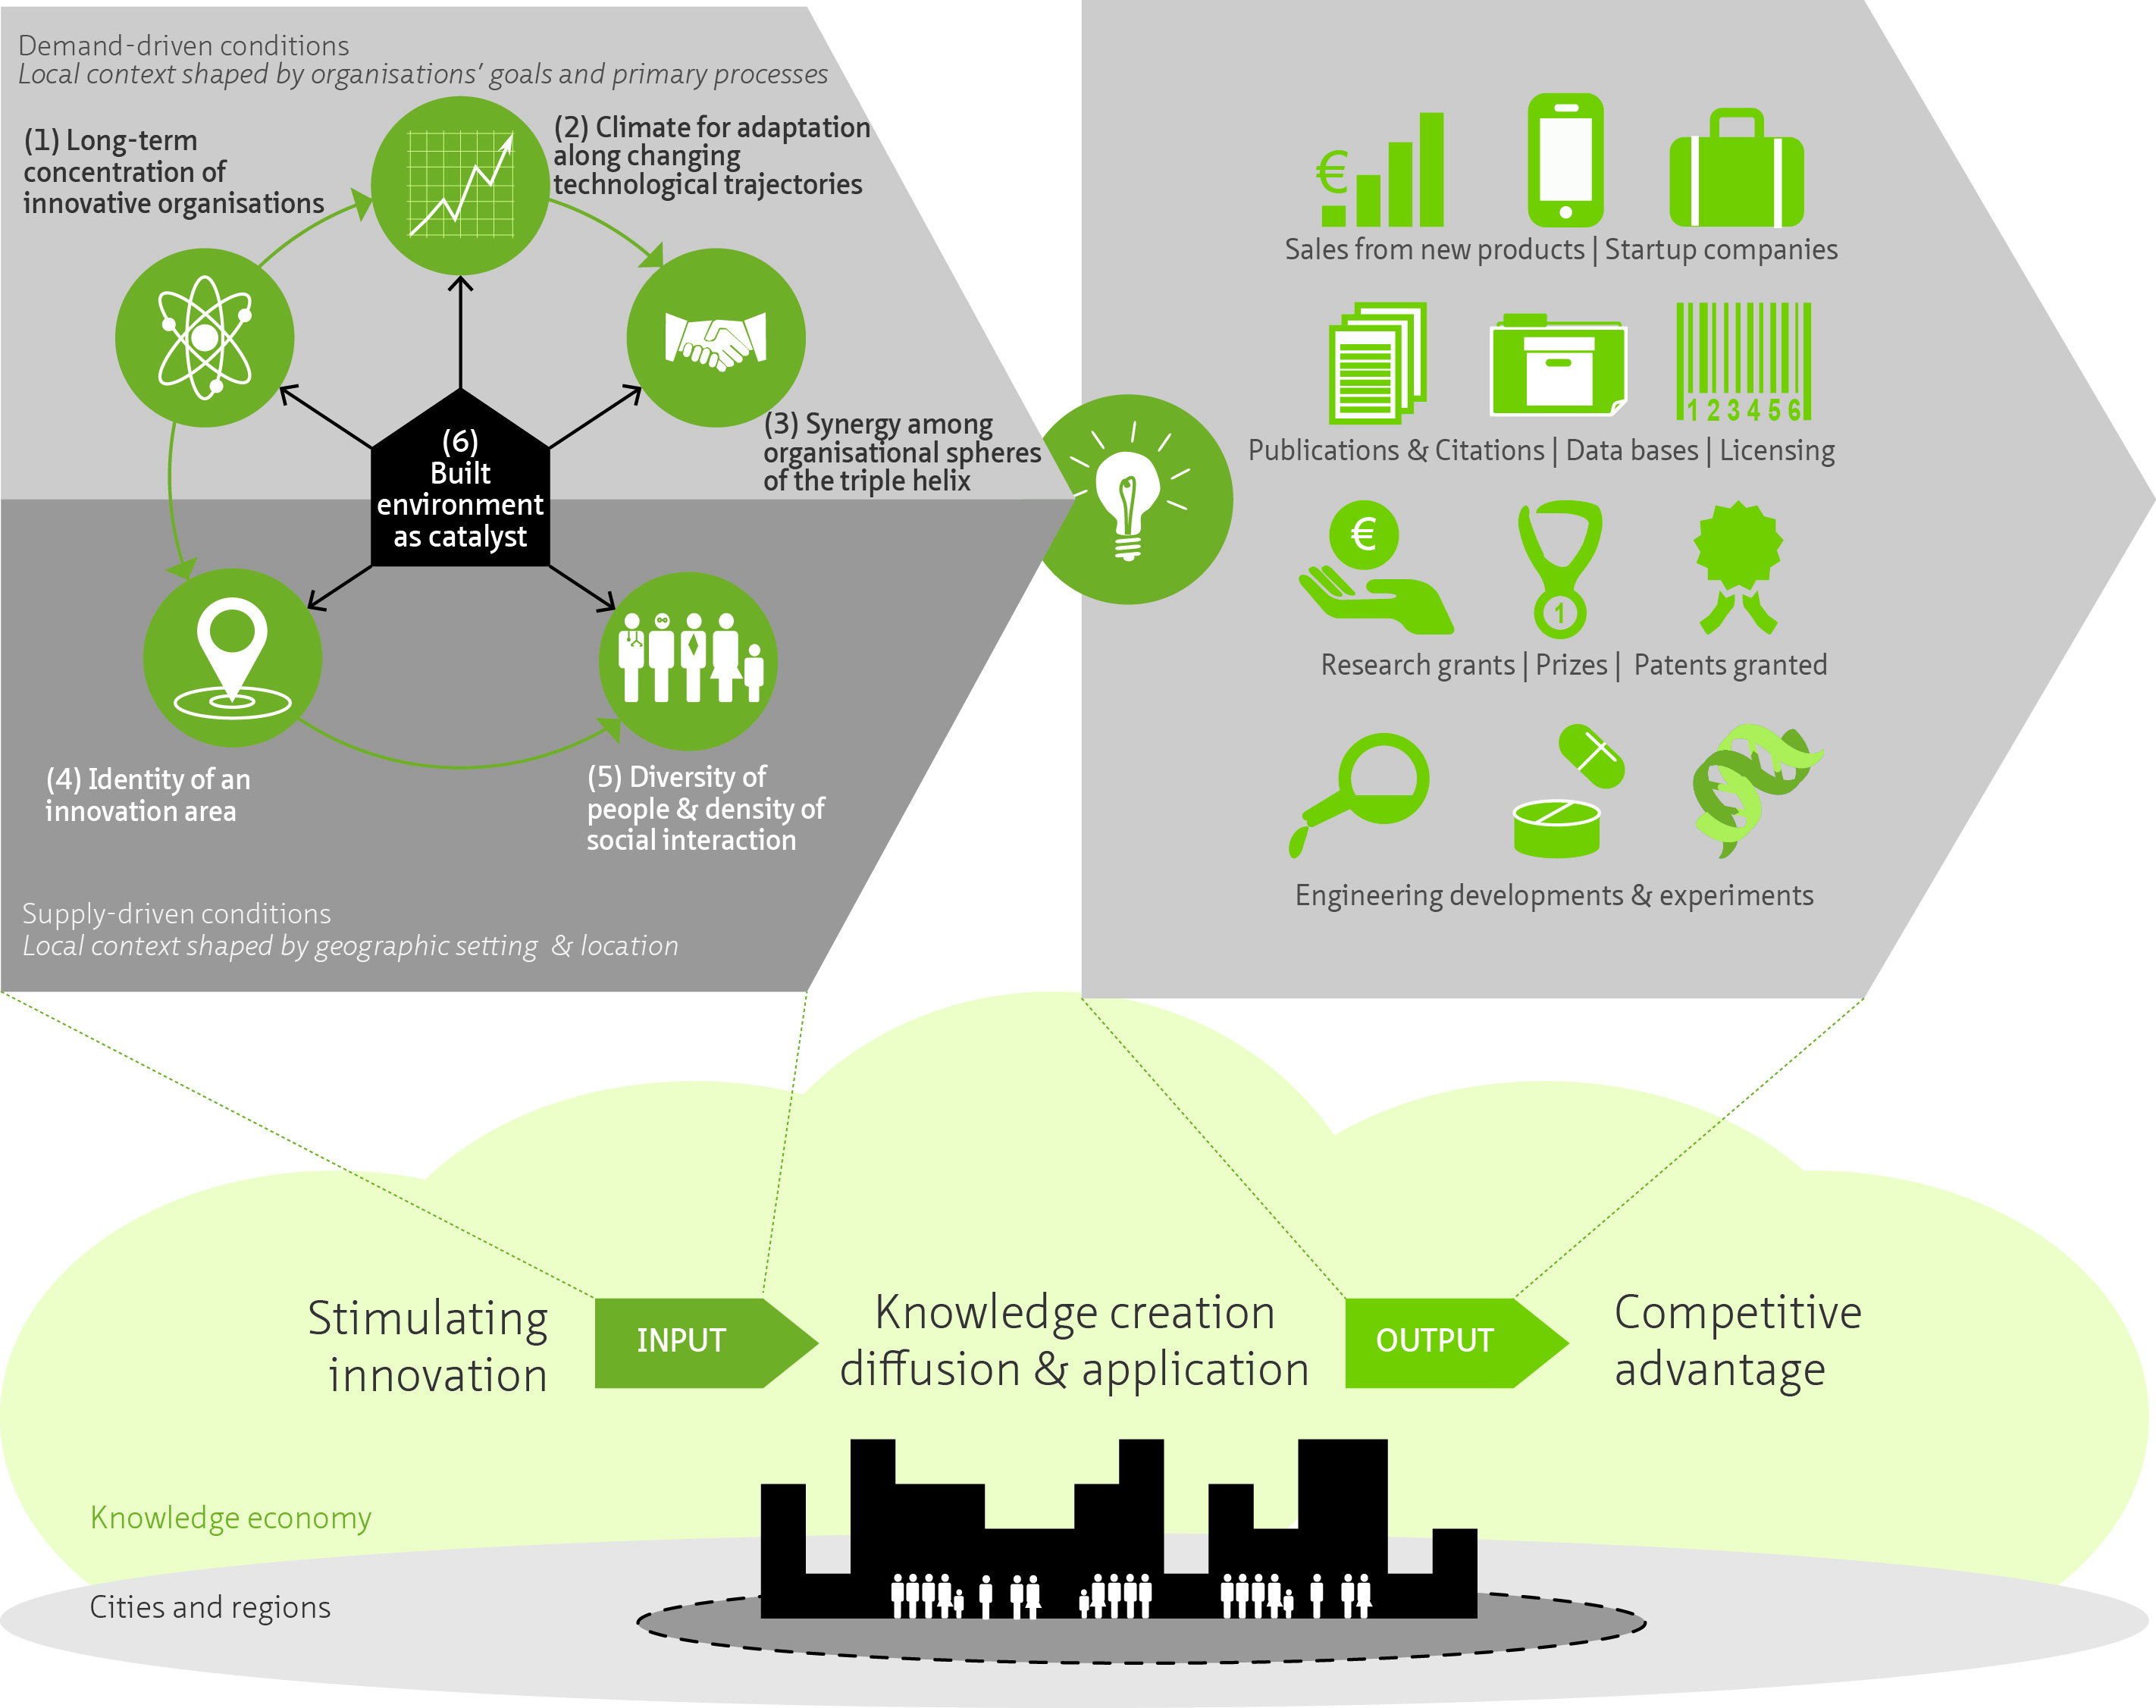
Map of relevant and interconnected sources building knowledge on the impact of real estate on organisational performance over the last two decadesOverview of the policy, studies, rankings and real estate developments influencing the development of technology campuses overtime.Map of some of the existing studies on cities in the knowledge economy (Carrillo, 2006; Groen & Sijde, 2002; Van Den Berg et al., 2005; Van Winden, 2011). Each colour refers to a different study.The concentration of human capital in the number of students and academic staff using a sample of 200 universities according to The Times Higher Education Top University Rankings 2011-2012Emergence and development of technology campuses in relation to periods of technology advancements and breakthrough inventions in industrialised regionsInnovation-area where HTCE locates in a regional context. Base map: Esri 2013Interrelated developments shaping the innovation climate at HTCE and the Brainport-Eindhoven areaDevelopment timeline of the HTCEInnovation area around MIT campus. Base map data: Esri, 2014Interrelated developments shaping the innovation climate at MIT and the Cambridge-Boston area (Data on sponsored research: MIT Institutional Research, 2014)Developments timelines of HTCE and MIT campus compared to each other.A conceptual model explaining the role of the built environment in innovation (Bottom: the system and its general context. Top: Input-conditions and output-indicators of innovation)